Essential mobile app metrics for engagement, retention & revenue
Last update: July 2026
Mobile apps generate thousands of data points daily. Teams that succeed don’t try to track everything. They focus on metrics that answer specific questions: Are users finding value? Are they coming back? Are campaigns driving revenue? With the right metrics, you spot friction in your onboarding flow, identify which features keep users engaged, and prove that your marketing spend generates returns.
In this post, we’ll cover essential mobile app metrics for engagement, retention, and revenue. You’ll learn how to pick the most relevant user metrics to analyze, see how to use funnels and user paths for deeper insight, and discover how non-technical marketing teams use Netmera as a customer engagement platform to go from insight to campaign launch in one dashboard.
What are mobile app metrics (and how they differ from web analytics)
Mobile app metrics measure user behavior and app performance. They track how users navigate your app, which features drive engagement, and whether users complete key actions like purchases, subscriptions, or account creation.
These metrics fall into categories: engagement shows how actively users interact, retention reveals whether they come back, and revenue connects behavior to financial results.
Mobile app metrics differ from web analytics because apps track persistent user sessions across days or weeks, not just individual visits. Apps collect data offline and sync later, track push notification engagement, and capture device-specific information like app version and operating system. Users often interact with apps in short bursts throughout the day rather than single browsing sessions. These differences mean mobile teams need specialized tracking that captures app-specific behaviors.
Metrics for measuring user engagement
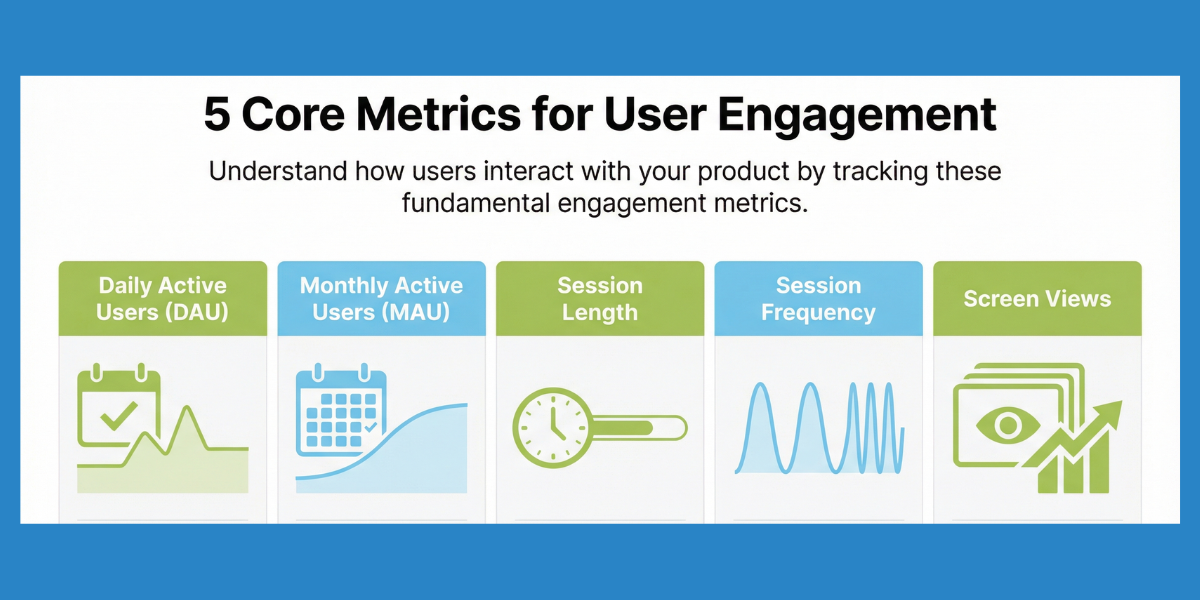
Daily active users (DAU) and monthly active users (MAU) count unique users who open your app within specific timeframes. The DAU/MAU ratio reveals how many monthly users return daily/monthly. A DAU/MAU ratio around 20% indicates solid engagement, while ratios exceeding 25% signal exceptional app stickiness (Source). These engagement metrics form the foundation of app growth metrics tracking.
Session length measures average time users spend per visit. Longer sessions often signal higher engagement, but context matters. Banking apps, for example, see shorter, frequent sessions while gaming apps expect longer ones.
Session frequency tracks how often individual users open your app. Frequency patterns help you time messages and predict future behavior.
AI-powered features like Netmera’s Best Time Delivery can analyze each user’s engagement patterns to automatically send notifications at their optimal times. Check out our post on choosing the best push send time.
Screen views reveal content consumption patterns. Tracking screens viewed per session makes it easy to spot whether users follow intended flows or create their own routes.
Tracking these engagement metrics helps you spot patterns, but patterns alone don’t change outcomes. A user who opens your app daily but never completes a purchase shows high engagement with low value. Mobile marketing metrics work best when they connect to specific business goals: retention, monetization, or growth. That requires deeper analysis through funnels and user paths, which we’ll cover shortly.
Metrics for tracking retention and loyalty
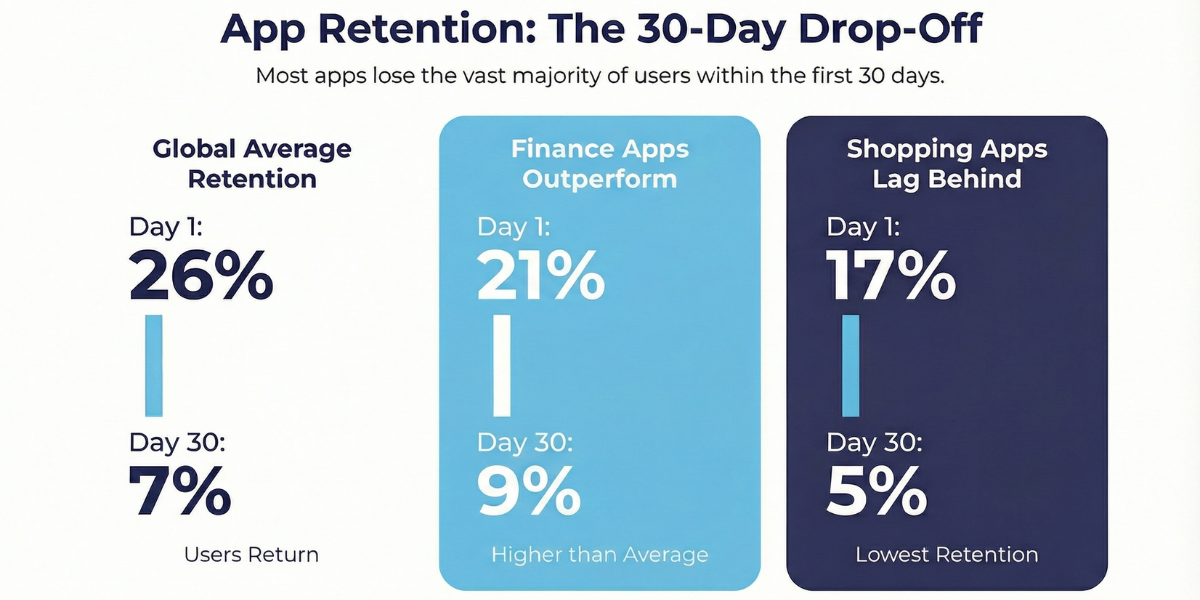
Retention rate measures the percentage of users who return after their first session. Global benchmarks show 26% Day 1 retention dropping to 7% by Day 30, though this varies by sector. Finance apps maintain 21% Day 1 and 9% Day 30 retention, while shopping apps see 17% and 5% respectively. (Source)
Netmera’s Retention & Cohort Reports track recurring usage habits over time, so you compare retention across user groups who started during the same period. You can see whether product changes improved or hurt long-term engagement, all through visual reports that don’t require technical skills to interpret.
Churn rate measures the percentage of users who stop using your app over a specific period. High churn signals onboarding friction, missing features, or competitive pressure. Understanding when users leave helps you address problems before they compound.
User lifetime value (LTV) estimates the total revenue a user generates over their entire relationship with your app. If your average LTV is $50, your customer acquisition cost must stay below that figure after accounting for your target profit margin. LTV calculations require tracking both retention and revenue metrics together.
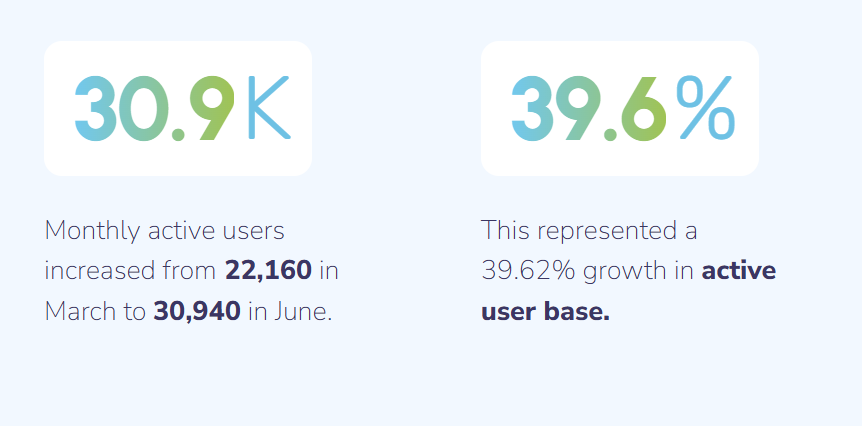
Tam Finans used retention metrics to identify users who’d gone inactive for seven days, then triggered win-back campaigns with Netmera’s automated push notifications. Monthly active users increased 39.6%, growing from 22,160 to 30,940 in three months.
Metrics for measuring revenue and proving ROI
Conversion rate tracks users who complete desired actions such as purchases, subscriptions, premium upgrades. Different segments convert differently, with returning visitors typically converting at 3.5-4.5% compared to new visitors at 2.5%, which makes them more valuable for revenue generation. (Source)
Average revenue per user (ARPU) divides total revenue by active users. Rising ARPU means better monetization through pricing, upsells, or increased engagement with paid features.
Purchase frequency measures transaction cadence. Some apps rely on frequent small purchases (mobile games), others on infrequent large transactions (travel bookings). Understanding your natural cadence helps time promotional campaigns.
Cart abandonment rate is one of the e-commerce customer experience metrics. Tracking abandonment by funnel stage shows whether users drop at product selection, shipping, or payment. Turkcell Pasaj, for example, used Netmera to automate cart recovery with behavioral push notifications, achieving a 150% revenue increase and doubling conversion rates from 4% to 8%. The project earned two SMARTIES Awards from MMA Türkiye and MMA MEA. Both recognized excellence in personalization and customer journey design.
Revenue metrics work best when connected to engagement and retention data. A user who engages frequently and sticks around for months generates far more revenue than one who makes a single purchase and churns.
All these metrics reveal what happened. The next question is when you learn about it and whether you can act while campaigns are still running.
Real-time mobile app metrics and post-click tracking
Most campaign performance metrics tools give limited analytics or make you rely on yesterday’s numbers. Real-time app metrics for marketing teams show what’s happening now and reveal how to track post-click behavior after users engage with campaigns whether they browsed, added to cart, or converted.
When we say Netmera tracks user behavior in real time, we mean it. You watch campaign performance unfold. Launch a flash sale at 9am, see low engagement at 10am, adjust messaging at 11am. Acting during active campaigns protects your budget and helps you capture opportunities before they disappear.
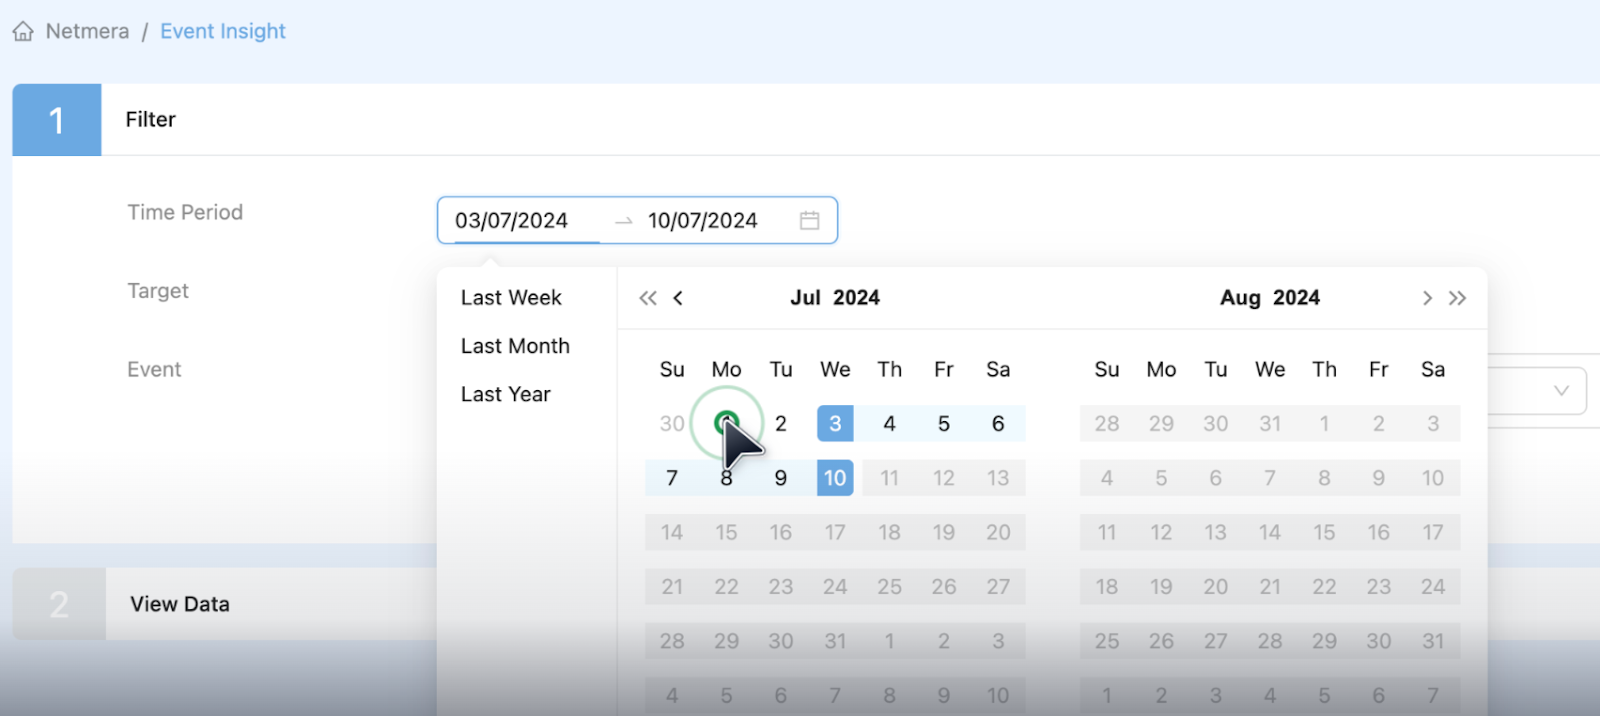
Event Insights is a reporting view our customers use to understand what users do after they engage. Viewed products? Added an item to the cart, or made a purchase? A push with 60% clicks might seem successful until you discover only 1% converted. Post-click tracking shows the difference between users who clicked out of curiosity versus those who clicked and completed a purchase.
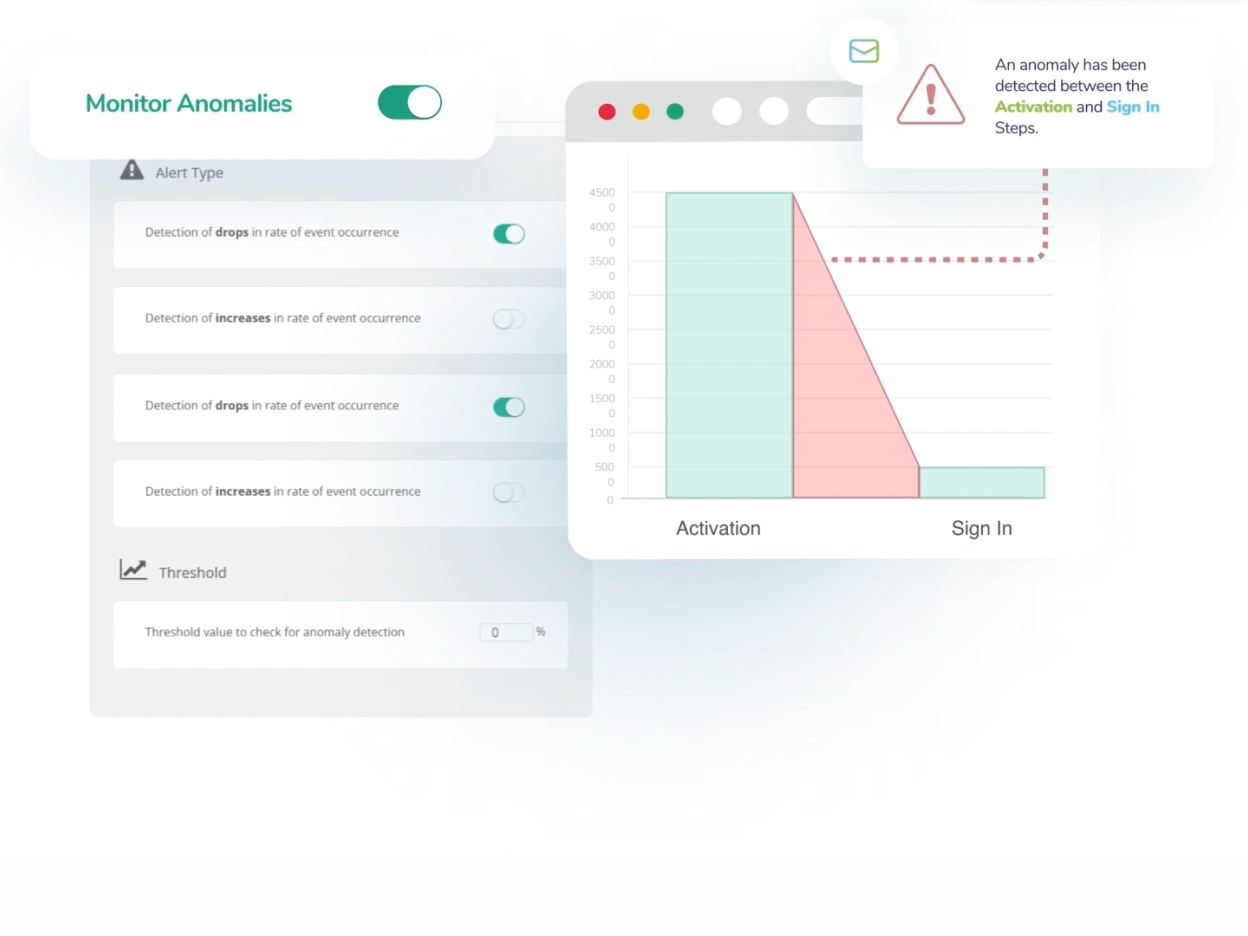
Uninstall spikes and engagement drops signal serious problems, but most teams discover them days late during weekly reviews. Netmera’s Track Anomalies identifies unusual patterns automatically and notifies you the moment something breaks from normal behavior. In funnels, this means daily or weekly checks that compare conversion against its own recent baseline.
How to analyze user behavior with Funnels and Paths
Individual metrics tell you what happened, but not where users struggle in specific flows. Netmera lets you track the metrics above and analyze multi-step processes with Funnels such as checkout flows, feature adoption, or onboarding sequences. This shows exactly where users drop off during critical journeys.
User paths rarely follow one fixed order. Netmera’s Funnels switch between strict, flexible, or any-order steps without a rebuild, so the analysis matches the sequence users actually take.
A session-based conversion window keeps the count honest too. Define 3 sessions for the conversion window. Step 1 happens in, let’s say, Session 1. The remaining steps have to land within the sessions that follow. A 4th session or later, and it’s not counted.
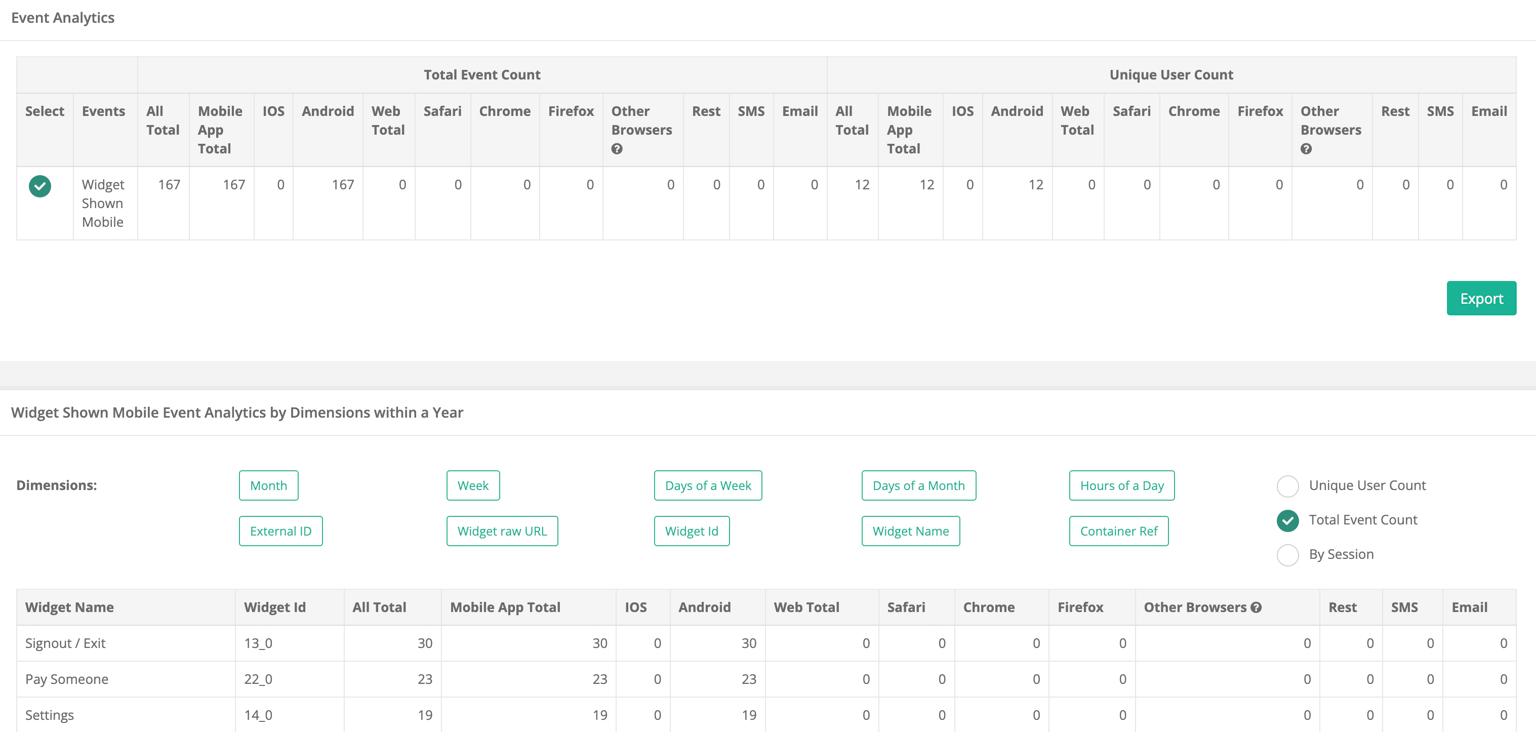
The same funnel can also answer two different questions in Netmera. Switch between Unique Users to see how many people converted, or Total Events to see how often the action happened. (Check the user guide for other capabilities.)
DenizBank noticed rising loan searches but falling applications. Using Netmera’s Funnels Analysis, they found a 50% drop-off where Android users with outdated devices couldn’t view contracts due to a loading bug. After fixing the issue and retargeting affected users with push notifications, they restored 10% conversion and cut bounce rates 41%.
Drop-off doesn’t have to end in a report. Netmera tags users who stalled at a step or dropped off the funnel entirely, so that segment is ready to export or retarget directly.
Our User paths map customer journey routes graphically. First Interaction shows entry points, Screen Views track navigation, Drop-Off Points reveal exits, Last Interaction captures final actions before leaving. Seeing those real paths helps you discover that maybe your most valuable users follow completely different routes than casual browsers.
Connect analytics and engagement in a single platform
Two key barriers prevent teams from launching lifecycle campaigns without developers. First, metrics live in separate tools: analytics here, campaigns there, revenue elsewhere. Connecting dots requires manual exports and coordination. Second, acting on insights needs IT support for building segments or adding tags. Marketing tools that don’t need engineering resources eliminate both barriers by unifying data collection, analysis, and campaign execution.
Netmera works as a no-code customer engagement platform that unifies three capabilities: customer data from mobile apps, websites, CRMs and data warehouses; real-time analytics that track user behavior; and omnichannel campaign tools for push, in-app widgets, WhatsApp, email, and SMS. You manage campaigns in one dashboard without filing IT tickets or switching between tools.
Track performance across all channels from one dashboard
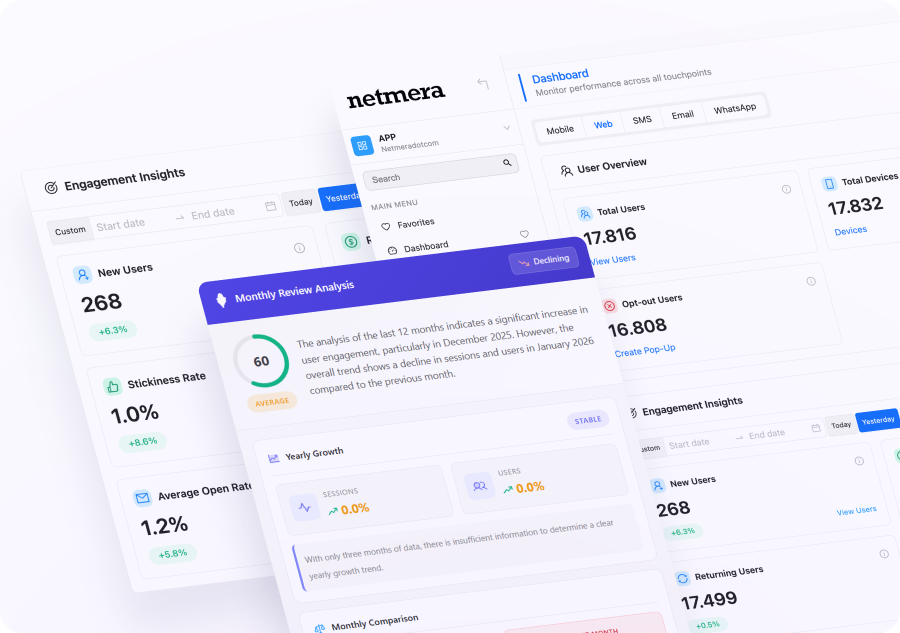
Tracking campaigns across push, email, SMS, web, and WhatsApp typically means switching between tools. Netmera provides a unified Dashboard where AI Insights surface behavior trends and engagement shifts automatically. Interactive cards let you spot delivery issues, click-through patterns, or opt-in changes, then drill into detailed reports without leaving the view. Daily and monthly analysis flags anomalies before they compound, giving you the visibility to act while campaigns are active.
Industry examples: How teams use analytics to launch campaigns
Here’s how product and marketing teams turn app metrics into marketing campaigns without switching platforms.
E-commerce: A growth lead spots cart abandonment rising in Funnels. She builds a segment from drop-off data, then launches a Journey with push notification followed by email with discount code if no purchase occurs. Revenue impact shows in the real-time dashboard within hours.
Fintech: A marketer identifies users who viewed investment products but didn’t complete signup. He segments this audience and sends targeted push notifications highlighting security features. Message Event Insights tracks post-click behavior to see completed registrations.
Banking: A product manager sees loan application drop-offs at the document upload stage through Funnels analysis. She creates a recovery segment and triggers a Journey with an in-app widget explaining the process, then an SMS reminder the next day. Conversion rate improvements appear in the funnel report.
Media: The team notices subscribers haven’t engaged with new content in seven days using Retention Reports. They segment inactive users and send personalized emails with content recommendations based on viewing history. Session frequency changes track re-engagement success.
These workflows succeed because Netmera functions as customer engagement software, proving measurable ROI. Real-time analytics with revenue tracking let you monitor KPIs as campaigns run and prove impact with actual numbers.
Message Event Insights tracks post-click behavior without separate attribution tools.
Funnels with anomaly detection catch performance drops before they compound, and alert you immediately. Contextual messaging across push, email, and SMS, and in-app coordinates based on user actions, and you send everything from one platform with almost zero IT involvement after initial setup.
Best tools for tracking mobile app metrics
Mobile analytics platforms fall into two categories: analytics-only tools that excel at measurement, and combined platforms that connect insights to campaigns. If you want to segment app users based on behavior and launch automated campaigns based on app analytics, combined platforms eliminate the gap between seeing patterns and acting on them.
Mixpanel offers event-based analytics for product teams, with behavior-based cohorts and retention analysis.
Amplitude focuses on product analytics, helping identify which user actions correlate with retention and revenue.
Google Analytics for Firebase (GA4) provides free mobile app analytics via the Firebase SDK, with strong integration into Google’s marketing tools for cross-platform insights.
Adjust specializes in mobile measurement and attribution, strong for understanding acquisition channel quality.
Netmera unifies mobile and web analytics with built-in engagement tools, functioning as a mobile analytics platform for high-volume apps. The platform combines behavioral tracking, funnel analysis capabilities for mobile apps, real-time monitoring, and campaign activation so teams identify patterns and launch campaigns immediately without exporting data or waiting on IT.
Getting started with app metrics that drive action
Start by identifying your primary goal: increasing active users, reducing churn, or improving monetization. Each goal determines your priority metrics.
The timeline for seeing value depends on your platform choice. Action-centric customer engagement platforms with automatic event tracking, like Netmera, let you launch your first behavioral campaign within days following the SDK integration. Traditional setups requiring manual integration for each channel extend timelines to weeks while you connect analytics tools to separate campaign platforms.
Choose platforms that close the gap between insight and execution to increase app engagement and conversions. Scalable engagement tools for lean marketing teams let you respond to user behavior immediately: spot a pattern, build a segment, launch a campaign while your users are still active.
Which metrics are you tracking? More importantly, which ones are you acting on? We can help you figure it out.

FAQs on essential mobile app metrics
Mobile app metrics measure user behavior and app performance. They track engagement patterns, retention rates, conversion actions, and revenue outcomes to help teams understand how users interact with their apps and make data-driven improvements.
Focus on retention rate (are users coming back?), conversion rate (are they completing valuable actions?), and session frequency (how often do they engage?). These three metrics directly connect user behavior to business outcomes.
Mobile apps track persistent user sessions across days, collect data offline, and monitor device-specific behaviors like push notification engagement. Web analytics primarily measure page views and single browsing sessions with less granular user identification.
Netmera unifies customer data from mobile apps and websites into single user profiles. This shows complete user journeys across devices, letting teams analyze behavior patterns and launch campaigns based on cross-platform actions.
Yes. Netmera’s Funnels provide visual reports showing exactly where users abandon multi-step processes like checkout or onboarding. You build custom funnels through a no-code interface, choose strict, flexible, or any-order steps, and set each funnel to public or private depending on who needs to see it.
With customer engagement platforms for non-technical marketing teams, you can launch campaigns within hours of spotting patterns. The platform handles segmentation, targeting, and multi-channel coordination through visual builders. Traditional setups where analytics and campaign tools are separate require data exports, manual imports, and IT support for each launch, stretching timelines to days or weeks.
Burcu Ulucay – Content Marketing, Netmera

